You can’t monitor what you can’t see. That seems overly simplistic, but it is the heart of the problem facing IT departments as their apps and other data resources are more widely dispersed among on-premises systems and across public and hybrid clouds.
Universal visibility will become more important in the future: according to the Cisco Global Cloud Index, 92% of all workloads will be processed in public and private clouds by 2020. To address this ‘visibility gap,’ companies have to find a way to identify and extract only the most relevant monitoring data to avoid swamping your monitoring, analytics, and security tools.
One problem is that in virtual data centers, 80% of all traffic is internal and horizontal, or ‘east-west,’ according to Cisco. By contrast, most cloud traffic travels vertically, or ‘north-south.’ They’re not designed to scale up and down fluidly as virtual machines are created, run their course, and disappear.
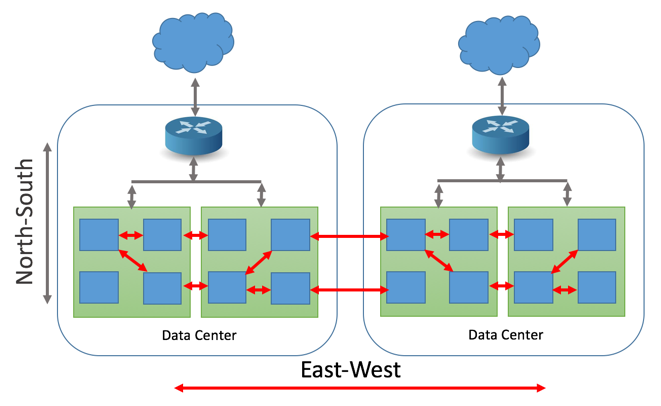
Adopting a virtualized infrastructure flips network traffic monitoring from predominantly east-west to predominantly north-south. Source: NeuVector
Realizing all the efficiency, scalability, and agility benefits of today’s virtualized infrastructures requires monitoring four distinct aspects of application traffic:
It’s not just the people charged with app performance monitoring who are racing to keep pace with the speed of virtualization. Security pros are struggling to find tools capable of identifying and reporting potential breaches of widely dispersed virtual networks. Network security managers often don’t have access to monitoring dashboards and are unaware of on-the-fly network reconfigurations.
This has led to a new approach to network modeling that extends virtual networks into the realms of security and compliance in addition to performance monitoring. The key is to normalize data from diverse sources ‘ whether physical, virtual or purely cloud-based ‘ and then apply a single set of network policies that encompasses security and performance monitoring.
Perhaps the biggest change in mindset is that all data traffic has to be treated the same. The traditional north-south pathway into and out of the network that’s always posed security and monitoring challenges, as well as the east-west transmissions inside the network that in the past were considered trusted and 100% contained. There is no longer a ‘trusted zone’ within the organization’s secured perimeter.
The approach that many companies are adopting successfully is to model north-south and east-west network traffic using a single set of policies. Doing so offers what Skybox Security VP of Products Ravid Circus calls ‘a more realistic view of applied policy at the host level rather than verifying access only at ‘chokepoints’ or gateways to the virtual network.‘ Relying on one unified policy also breaks down the traditional barriers separating physical, virtual, and cloud networks, according to Circus.
How important is it to keep virtualized environments running at peak performance? In the words of OpsDataStore founder Bernd Harzog, ‘slow is the new down.’ Harzog cites an Amazon study that found an added 100 milliseconds of latency translated to a 1% decrease in online sales revenue for the year. The monitoring challenge is compounded by the confluence of four trends:

The monitoring challenge: faster, more frequent app deployments on increasingly abstracted, dynamic, and automated virtual infrastructures. Source: Network World
If you’re relying on a single vendor for your network monitoring operations, you’re missing out. The new reality is multiple tools from multiple vendors, which makes it critical to select the optimum set of tools for your environment. The pit many companies fall into is what Harzog calls the ‘Franken-Monitor:’ Each team relies on its own favorite tool at the exclusion of all others, so you spend all your time trying to move performance data between these virtual silos.
To avoid creating a monitoring monster, place the metric streams from all the tools in a common, low-latency, high-performance back-end that lets the performance data drive IT the same way business data drives business decision making. That’s where a service such as Morpheus proves its true value.
Morpheus is complete cloud application management platform that combines all your vital data assets in a single place so you can quickly find, use, and share custom reports highlighting resource activity and app and server capacity. All system, database, and application logs are collected automatically for near-instant analysis and troubleshooting. The moment you provision a new system, it is set up for uptime monitoring automatically, complete with proactive, customizable alerts. Best of all, Morpheus keeps IT moving at cloud speed without launching your IT budget into the stratosphere.